Monitoring with Prometheus
You can monitor your SUSE Manager environment using Prometheus and Grafana. SUSE Manager Server and Proxy are able to provide self-health metrics, or install and manage a limited number of Prometheus exporters on Salt clients.
Prometheus is a monitoring tool that is used to record real-time metrics in a time-series database. It is an open-source software project, written in Go. Metrics are collected using HTTP pulls, allowing for higher performance and scalability. For more information about Prometheus, see https://prometheus.io/docs/.
Grafana is a tool for data visualization, monitoring, and analysis. It is used to create dashboards with panels representing specific metrics over a set period of time. Grafana is commonly used together with Prometheus, but also supports other data sources such as ElasticSearch, MySQL, PostgreSQL, and Influx DB. For more information about Grafana, see https://grafana.com/docs/.
You need to install Prometheus and Grafana on a machine separate from the SUSE Manager Server. We recommend you use a managed Salt client as your monitoring server.
Prometheus and Grafana packages are included in the SUSE Manager Client Tools for SUSE Linux Enterprise 12 and SUSE Linux Enterprise 15.
Prometheus Metrics
Prometheus metrics are time series data, or timestamped values belonging to the same group or dimension. A metric is uniquely identified by its name and set of labels.
   metric name               labels                 timestamp     value
┌────────┴───────┐  ┌───────────┴───────────┐    ┌──────┴──────┐  ┌─┴─┐
http_requests_total{status="200", method="GET"}  @1557331801.111  42236
Each application or system being monitored must expose metrics in the format above, either through code instrumentation or Prometheus exporters.
The different metric types are:
-
Counter - cumulative values. For example, number of errors
-
Gauge - can go up or down. For example, temperature
-
Histogram - count observations in buckets
-
Summary - similar to histogram, but provides totals (sum and count)
For more information about metric types, see https://prometheus.io/docs/concepts/metric_types/.
PromQL
Prometheus has its own query language called PromQL, which is a functional expression language. PromQL allows you to filter multi-dimensional time series data. It is used in all Prometheus interactions.
In PromQL, an expression can evaluate to one of three types:
-
Instant vector: a set of time series containing a single sample for each time series, all sharing the same timestamp
-
Range vector: a set of time series containing a range of data points over time for each time series
-
Scalar: a numeric floating point value
The core part of any PromQL query is the metric name, for example, http_requests_total. Labels can be used as optional selectors. This example returns the total number of HTTP requests that have status 200 and method GET:
http_requests_total{status="200", method="GET"}
For more information about PromQL, see the official Prometheus documentation at https://prometheus.io/docs/prometheus/latest/querying/basics/.
Exporters
Exporters are libraries that help with exporting metrics from third-party systems as Prometheus metrics. Exporters are useful whenever it is not feasible to instrument a given application or system with Prometheus metrics directly. Multiple exporters can run on a monitored host to export local metrics.
The Prometheus community provides a list of official exporters, and more can be found as community contributions. For detailed information and an extensive list of exporters, see https://prometheus.io/docs/instrumenting/exporters/.
With SUSE Manager 4, you can set up the Server and Proxy to expose Prometheus metrics to provide insights about self-health of SUSE Manager. Metrics are available for these services:
-
Hardware and Operating System
-
Java Virtual Machines
-
Apache
-
Squid
-
PostgreSQL
-
SUSE Manager internals
The self-health metrics are made available by SUSE Manager Java application combined with Prometheus standalone exporters, running as systemd daemons.
SUSE Manager requires these packages to be installed on the Server and the Proxy. The packages are shipped with SUSE Manager Server and Proxy, but their respective systemd daemons are disabled by default.
These exporter packages are shipped with SUSE Manager Server:
-
Node exporter:
golang-github-prometheus-node_exporter. See https://github.com/prometheus/node_exporter. -
PostgreSQL exporter:
golang-github-wrouesnel-postgres_exporter. See https://github.com/wrouesnel/postgres_exporter. -
JMX exporter:
prometheus-jmx_exporter. See https://github.com/prometheus/jmx_exporter. -
Apache exporter:
golang-github-lusitaniae-apache_exporter. See https://github.com/Lusitaniae/apache_exporter.
These exporter packages are shipped with SUSE Manager Proxy:
-
Node exporter:
golang-github-prometheus-node_exporter. See https://github.com/prometheus/node_exporter. -
Squid exporter:
golang-github-boynux-squid_exporter. See https://github.com/boynux/squid-exporter.
Install and Configure Prometheus
Prometheus is installed on your monitoring server from a package, and needs configuration before you can use it to gather metrics. We recommend you use a managed Salt client as your monitoring server.
Installing Prometheus
If your monitoring server is a SUSE Manager client, you can install the Prometheus package using the SUSE Manager Web UI. Otherwise you can download and install the package on your monitoring server manually.
-
On the monitoring server, install the
golang-github-prometheus-prometheuspackage:zypper in golang-github-prometheus-prometheus
-
Enable the Prometheus service:
systemctl enable --now prometheus
-
Check that the Prometheus interface is loading correctly. In your browser, navigate to the URL of the server where Prometheus is installed, and listen on port 9090 (for example,
http://example.com:9090).
Configuring Prometheus
Prometheus requires some configuration to collect metrics and set up alarms, or to display metrics graphically in Grafana.
You can configure Prometheus in the static configuration file at /etc/prometheus/prometheus.yml.
It is important to understand how this file is structured.
For example:
yaml
- job_name: 'suse-manager-server'
  static_configs:
    - targets:
      - 'suse-manager.local:9100'  # Node exporter
      - 'suse-manager.local:9187'  # PostgreSQL exporter
      - 'suse-manager.local:5556'  # JMX exporter (Tomcat)
      - 'suse-manager.local:5557'  # JMX exporter (Taskomatic)
      - 'suse-manager.local:9800'  # Taskomatic
    - targets:
      - 'suse-manager.local:80'    # Message queue
      labels:
        __metrics_path__: /rhn/metrics
For more information about configuring Prometheus, see the official Prometheus documentation at https://prometheus.io/docs/prometheus/latest/configuration/configuration/
Monitoring Salt Clients
Prometheus metrics exporters can also be used on Salt clients. The packages are available from the SUSE Manager client tools channels, and can be enabled and configured directly in the SUSE Manager Web UI. Currently, two exporters are supported:
-
Node exporter:
golang-github-prometheus-node_exporter. See https://github.com/prometheus/node_exporter. -
PostgreSQL exporter:
golang-github-wrouesnel-postgres_exporter. See https://github.com/wrouesnel/postgres_exporter.
Installing and configuring exporters is done using a Salt formula.
When you have the exporters installed and configured, you can begin using Prometheus to scrape metrics from monitored systems. You can do this directly through the SUSE Manager Web UI, or set up service discovery. Service discovery instructs Prometheus to automatically scrape metrics from systems as they are enabled.
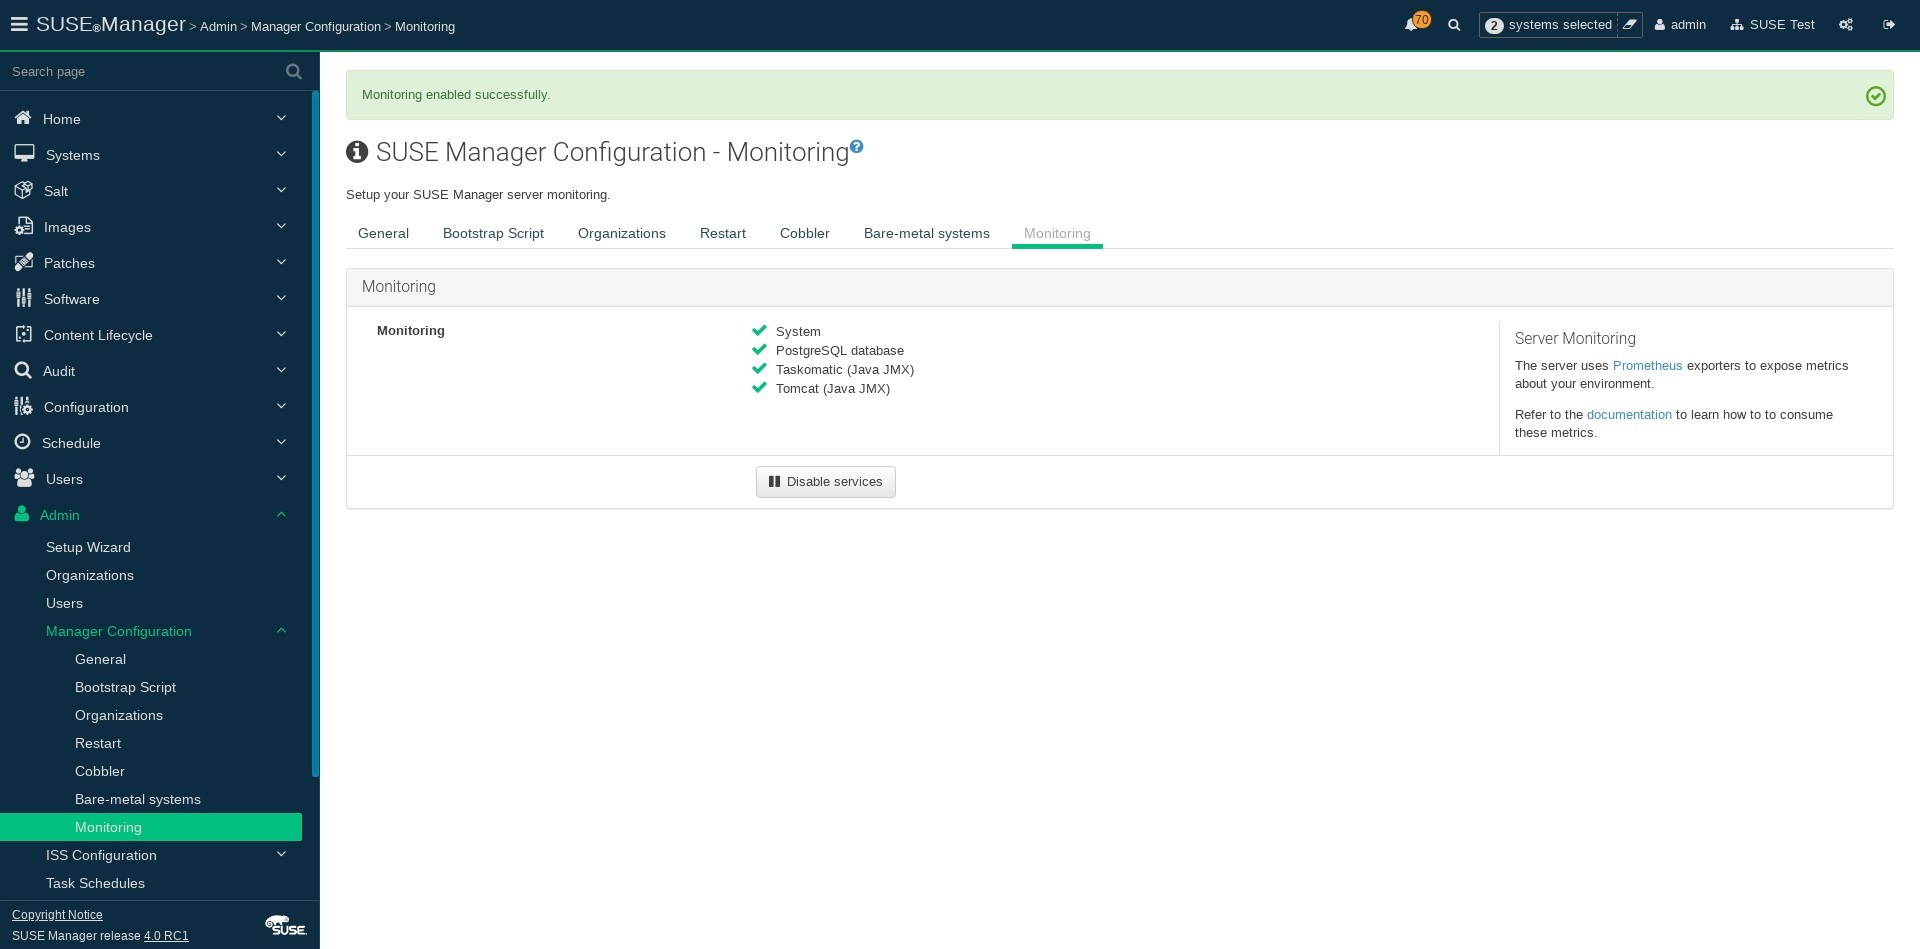
Enable and Configure Monitoring
-
In the SUSE Manager Web UI, navigate to .
-
Click Enable services.
-
In the SUSE Manager Web UI, open the details page of the system to be monitored, and navigate to the
Formulastab. -
Check the
Monitoringcheckbox to select all monitoring formulas, and click Save. -
Apply the highstate.
-
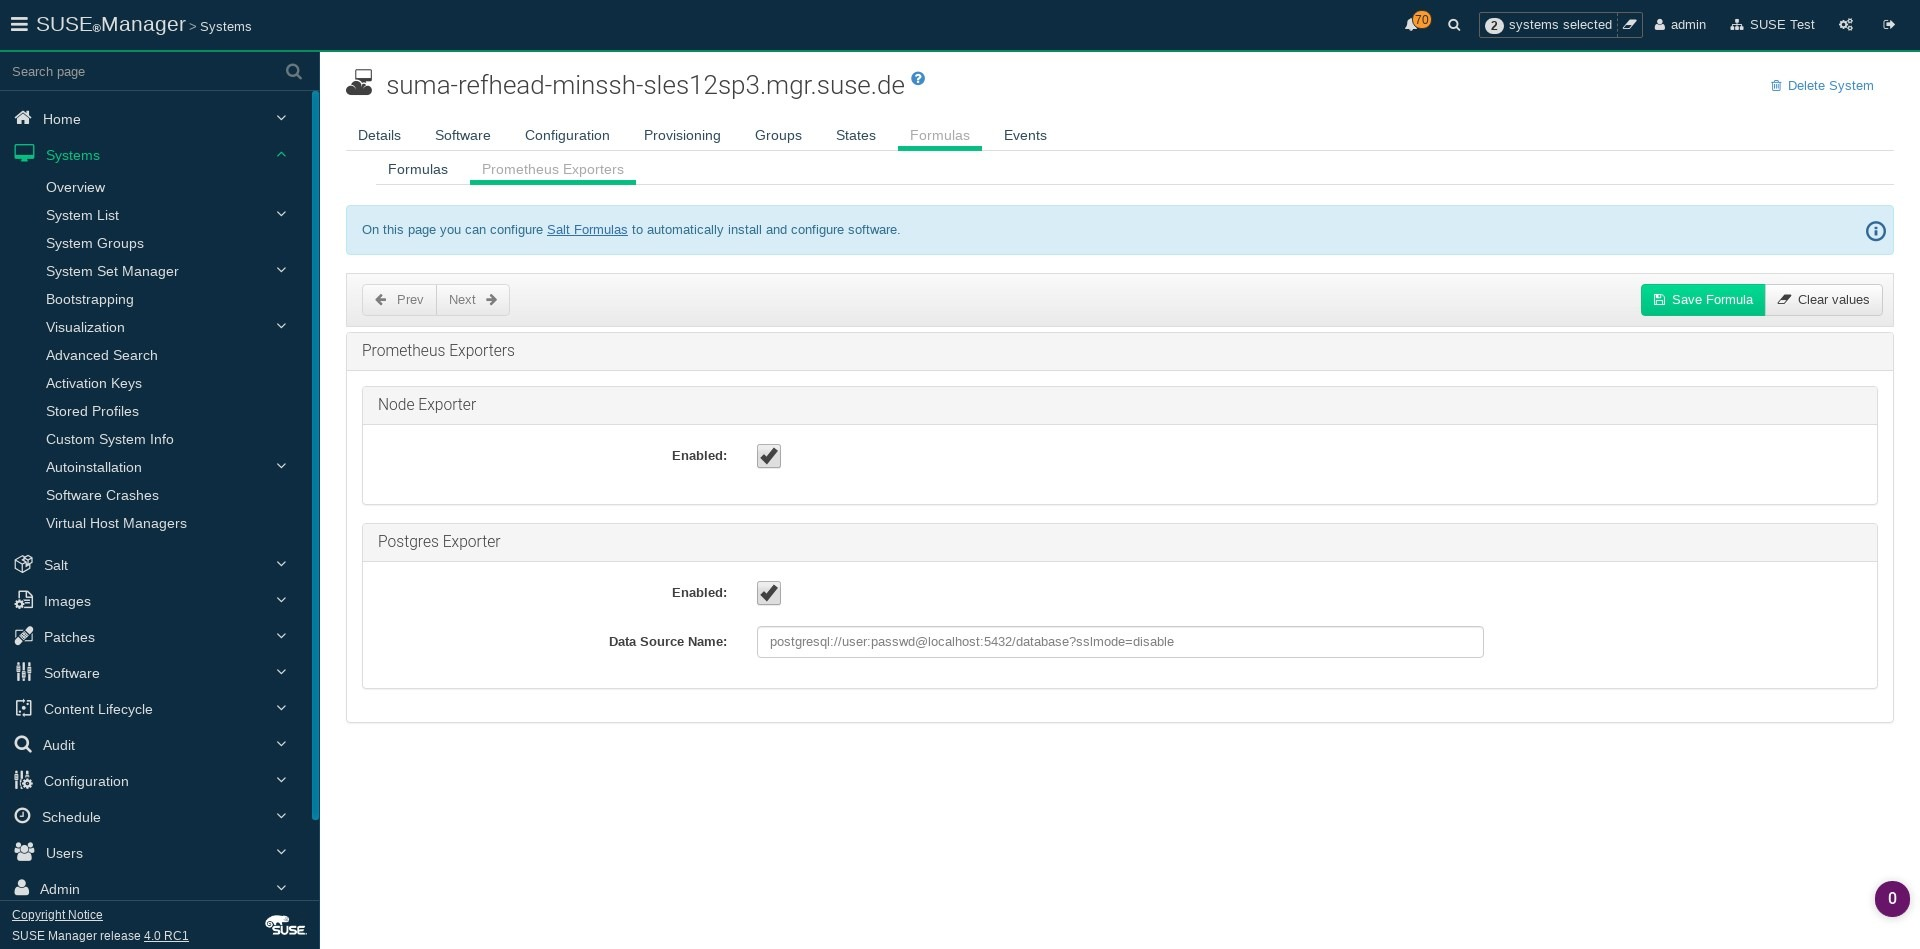
In the SUSE Manager Web UI, open the details page of the system to be monitored, and navigate to the tab.
-
Check the
Enabledcheckbox for both the Node and the Postgres Exporter. -
In the
Postgres Exportersection, in theData Source Namerfield, enter the path to your data source (for example,postgresql://user:passwd@localhost:5432/database?sslmode=disable). -
Click Save Formula.
-
Apply the highstate.
|
Procedure: Enable Service Discovery
This feature is a technical preview available in SUSE Manager 4.0.2 and later. It should not be used in production systems. |
-
On the monitoring server, open the Prometheus static configuration file
/etc/prometheus/prometheus.yml. -
Add or update the scrape configurations section:
job_name: 'suma'
uyuni_sd_configs:
host: "http://your-suse-manager-server-url"
username: "apiuser"
password: "password"
-
Save the configuration file and restart the Prometheus service:
systemctl restart prometheus
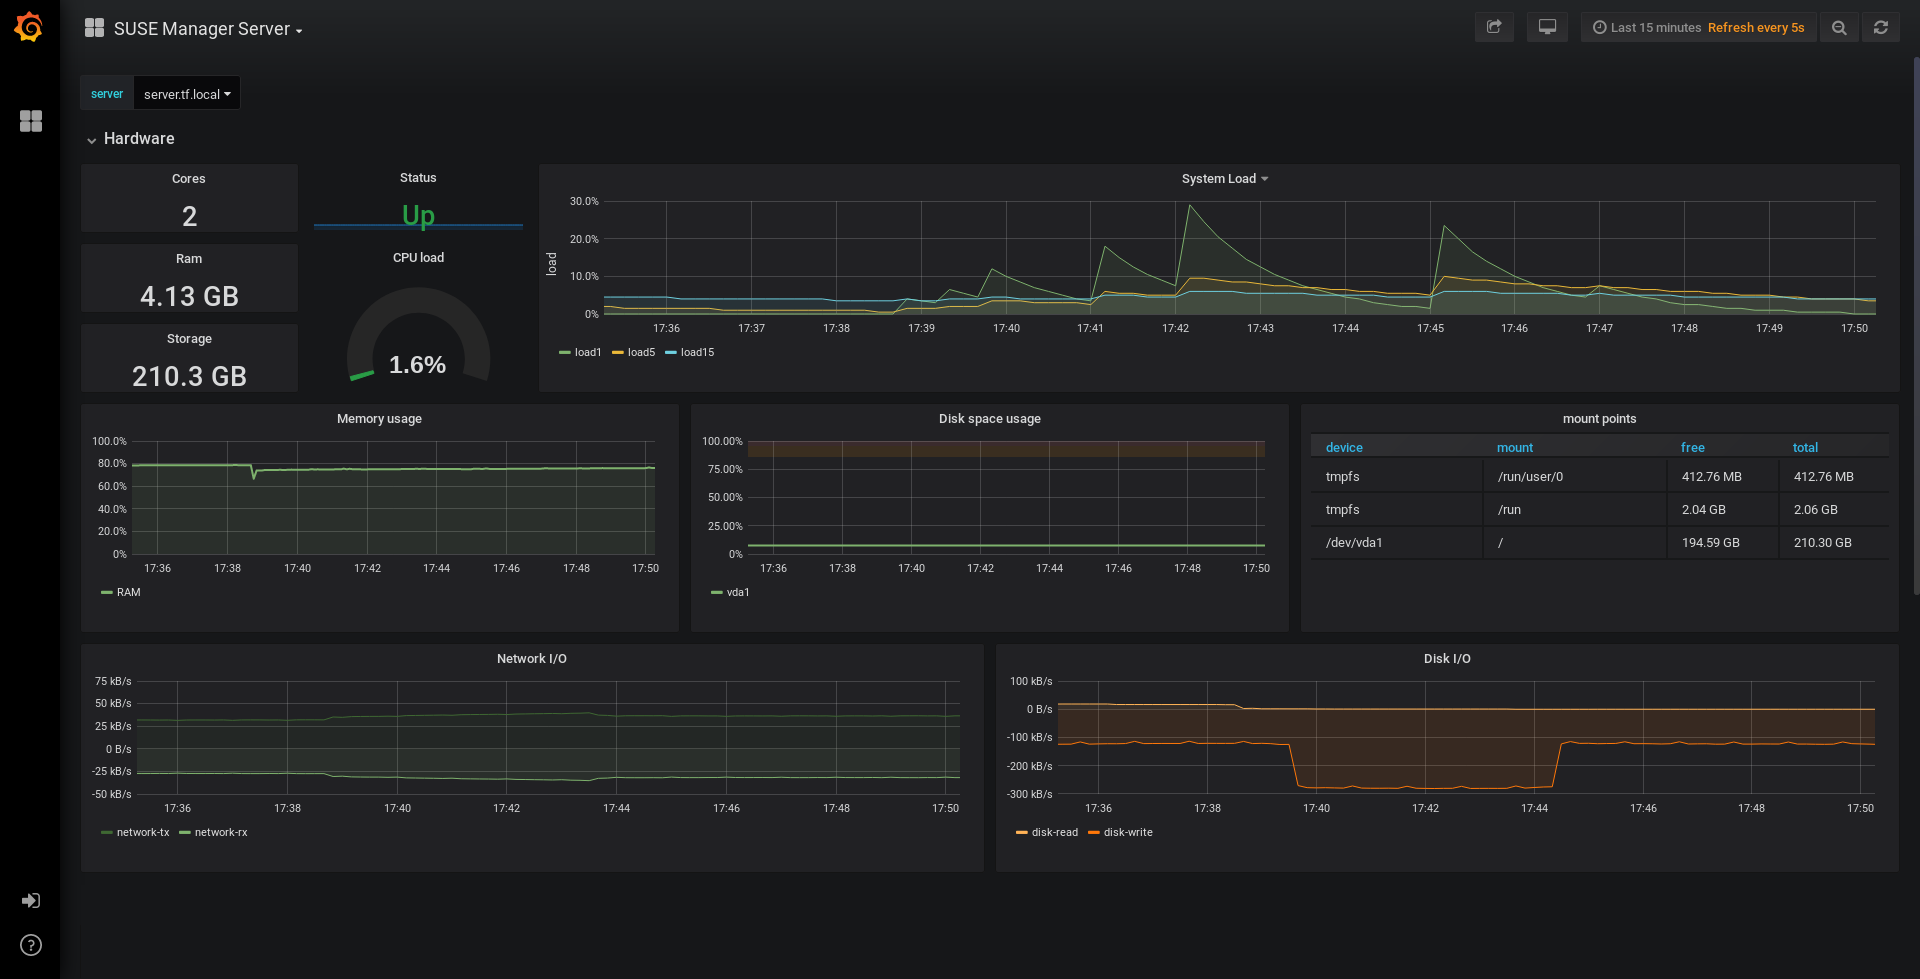
Visualization with Grafana
The Grafana website contains dozens of dashboards uploaded by the community. For an example of the SUSE Manager dashboard, see https://grafana.com/dashboards/10277. For more information about dashboards, see https://grafana.com/dashboards
To use Grafana with SUSE Manager, you must enable metrics in the SUSE Manager Web UI and configure your Prometheus instance to collect those metrics.
If your monitoring server is a SUSE Manager client, you can install the Grafana package using the SUSE Manager Web UI. Otherwise you can download and install the package on your monitoring server manually.
-
Install the
grafanapackage:zypper in grafana
-
Enable the Grafana service:
systemctl enable --now grafana-server
-
Navigate to port 3000 in your browser.
Grafana settings are configured in /etc/grafana/grafana.ini.